How to Master Chart Reading in Day Trading: A Comprehensive Guide
Day trading is a popular strategy that involves buying and selling financial instruments within the same trading day. To be successful in day trading, one must have a solid understanding of chart reading. In this blog post, we will discuss the importance of chart reading in day trading and provide a comprehensive guide on how to master this essential skill.
The Importance of Chart Reading in Day Trading
Chart reading is a crucial aspect of day trading as it allows traders to analyze historical price movements and identify potential trends. By studying charts, traders can gain valuable insights into market behavior and make informed decisions about when to buy or sell. Chart reading can help traders identify support and resistance levels, as well as patterns such as double tops, head and shoulders, and flags. By understanding these patterns, traders can better predict future price movements and maximize their profits.
How to Master Chart Reading
1. Get Familiar with Different Chart Types
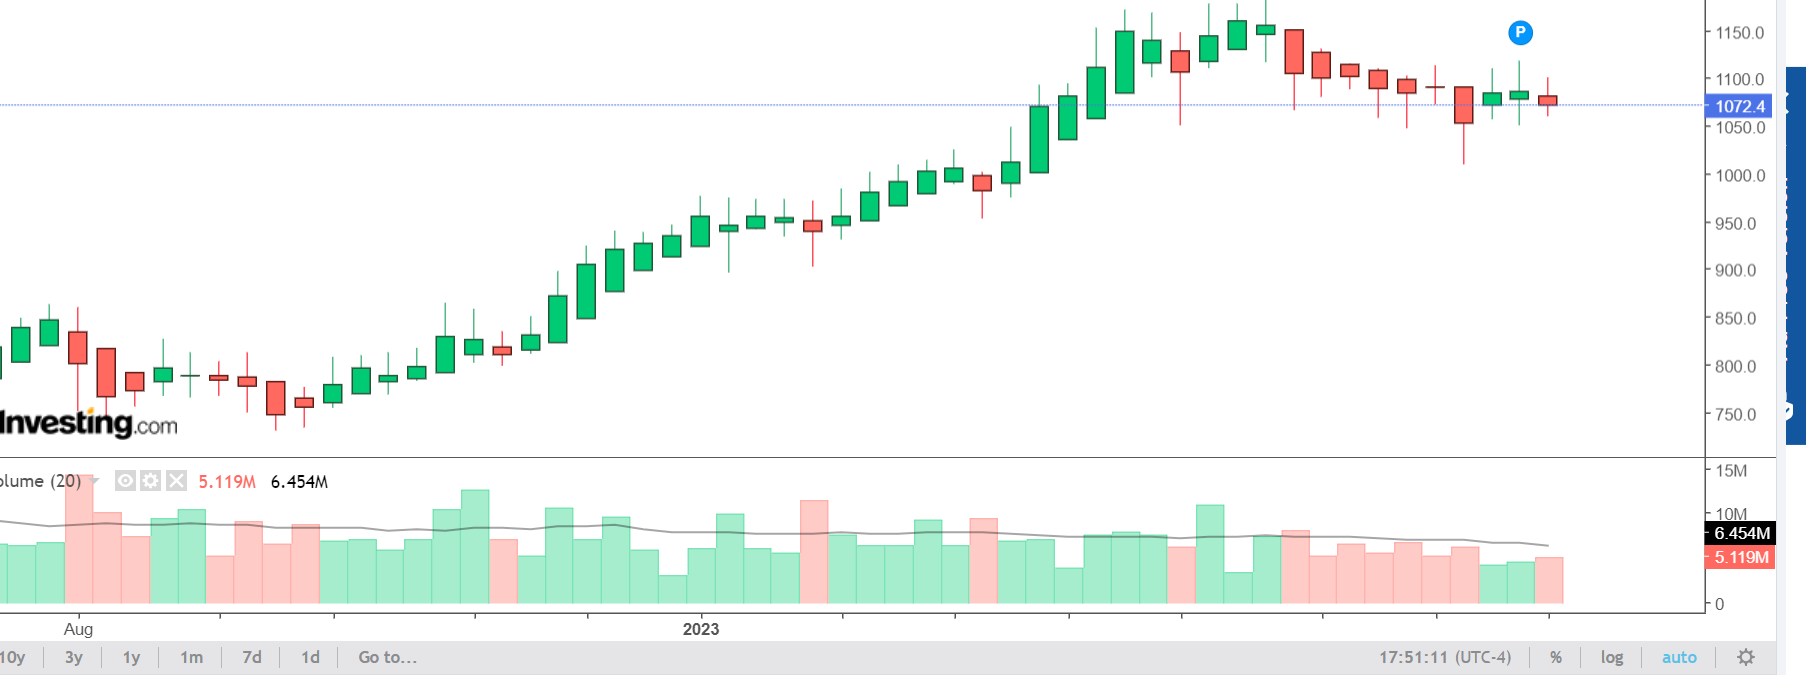
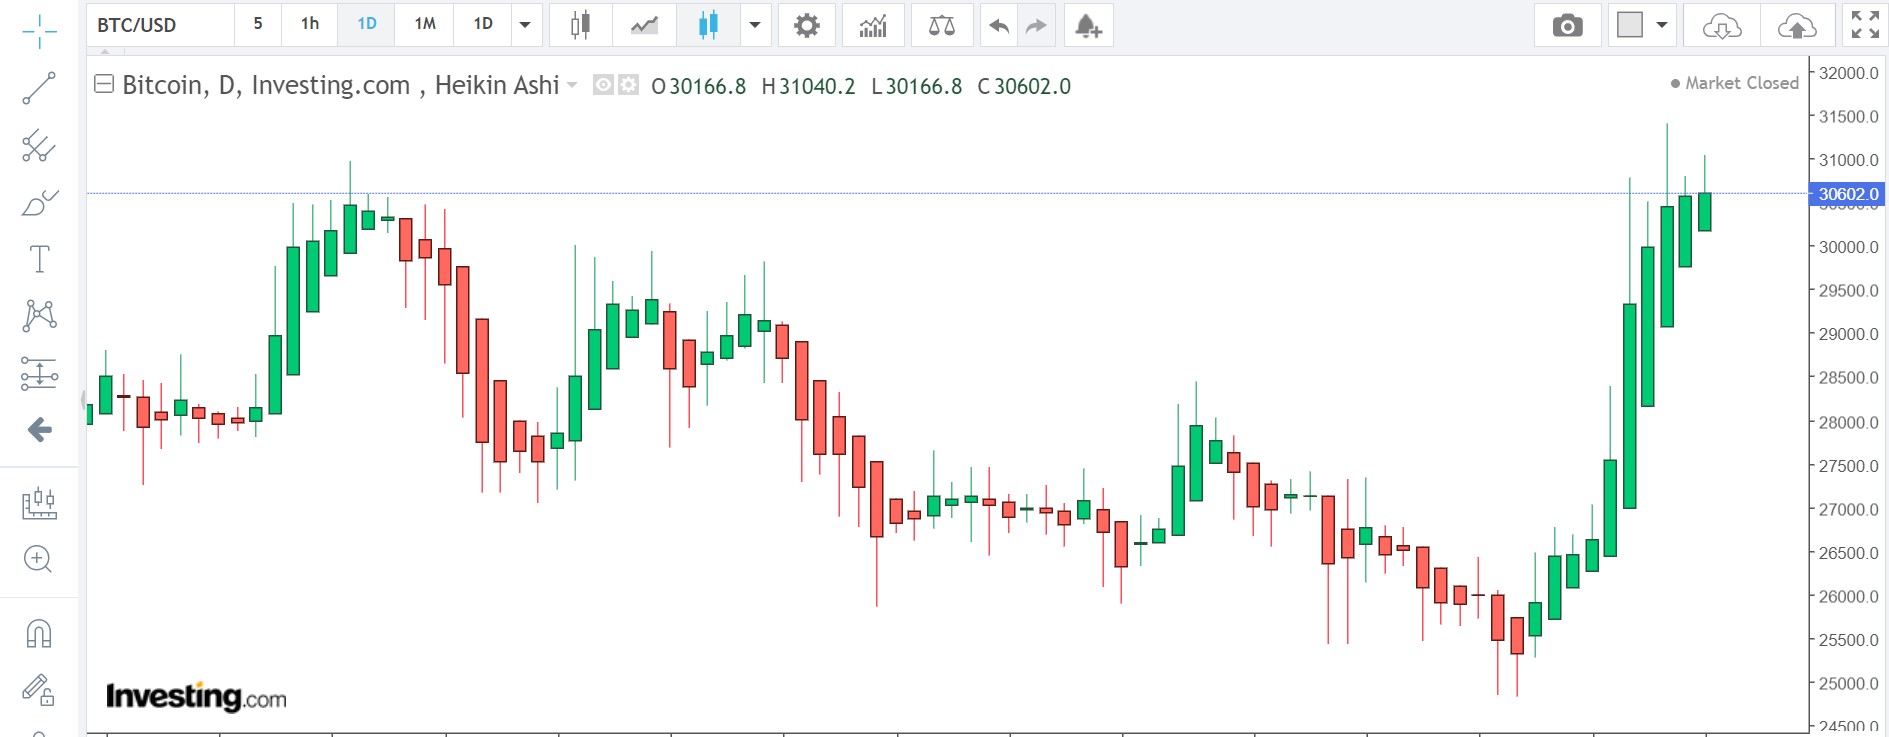
There are several types of charts used in day trading, including line charts, bar charts, and candlestick charts. Each chart type has its own unique advantages and disadvantages, so it’s essential to familiarize yourself with them. Line charts are simple and easy to read, while bar charts provide more detailed information about price movements. Candlestick charts are widely used in day trading due to their ability to show market sentiment through patterns such as doji, hammer, and engulfing.
2. Learn to Identify Trends
One of the key skills in chart reading is the ability to identify trends. Trends can be classified as uptrends, downtrends, or sideways trends. By recognizing these trends, traders can determine the overall direction of the market and adjust their trading strategy accordingly. Trendlines are a useful tool for identifying trends, as they connect swing highs and swing lows to provide a visual representation of market direction.
3. Use Technical Indicators
Technical indicators are mathematical calculations based on historical price and volume data. These indicators can help traders confirm trend signals, identify overbought or oversold conditions, and pinpoint potential entry and exit points. Popular technical indicators used in chart reading include moving averages, Relative Strength Index (RSI), and Bollinger Bands.
4. Practice, Practice, Practice
Like any skill, mastering chart reading takes time and practice. Start by analyzing historical charts and identifying patterns and trends. Practice using different technical indicators and experiment with different chart types to see which ones work best for you. Keep a trading journal to track your progress and learn from your successes and failures. With dedication and perseverance, you can become proficient in chart reading and improve your day trading performance.
Conclusion
Chart reading is a fundamental skill for day traders looking to succeed in the fast-paced world of investing. By understanding different chart types, identifying trends, using technical indicators, and practicing consistently, traders can enhance their decision-making abilities and increase their chances of profitability. Mastering chart reading takes time and effort, but the rewards are well worth it. Start honing your chart reading skills today and take your day trading to the next level!