Mastering Chart Reading in the Stock Market, the complete Guide by Pyjamastraders
Chart reading is an essential skill for any investor or trader in the stock market. The backbone for day trading. By analyzing price patterns and trends, chart reading allows market participants to make informed decisions about buying, selling, or holding stocks. In this blog post, we will look deep into the intricacies of chart reading, exploring various types of charts, key technical indicators, and effective strategies to enhance your trading Knowledge.
1. Understanding Different Types of Charts
Charts are graphical representations of price movements over time, providing valuable insights into market behavior. Here are the most commonly used types of charts:
1.1 Line Charts
Line charts connect closing prices over a specific period, forming a continuous line that helps identify trends and support/resistance levels.
1.2 Bar Charts
Bar charts display the open, high, low, and close prices for each period as vertical bars, offering a more detailed view of price action.
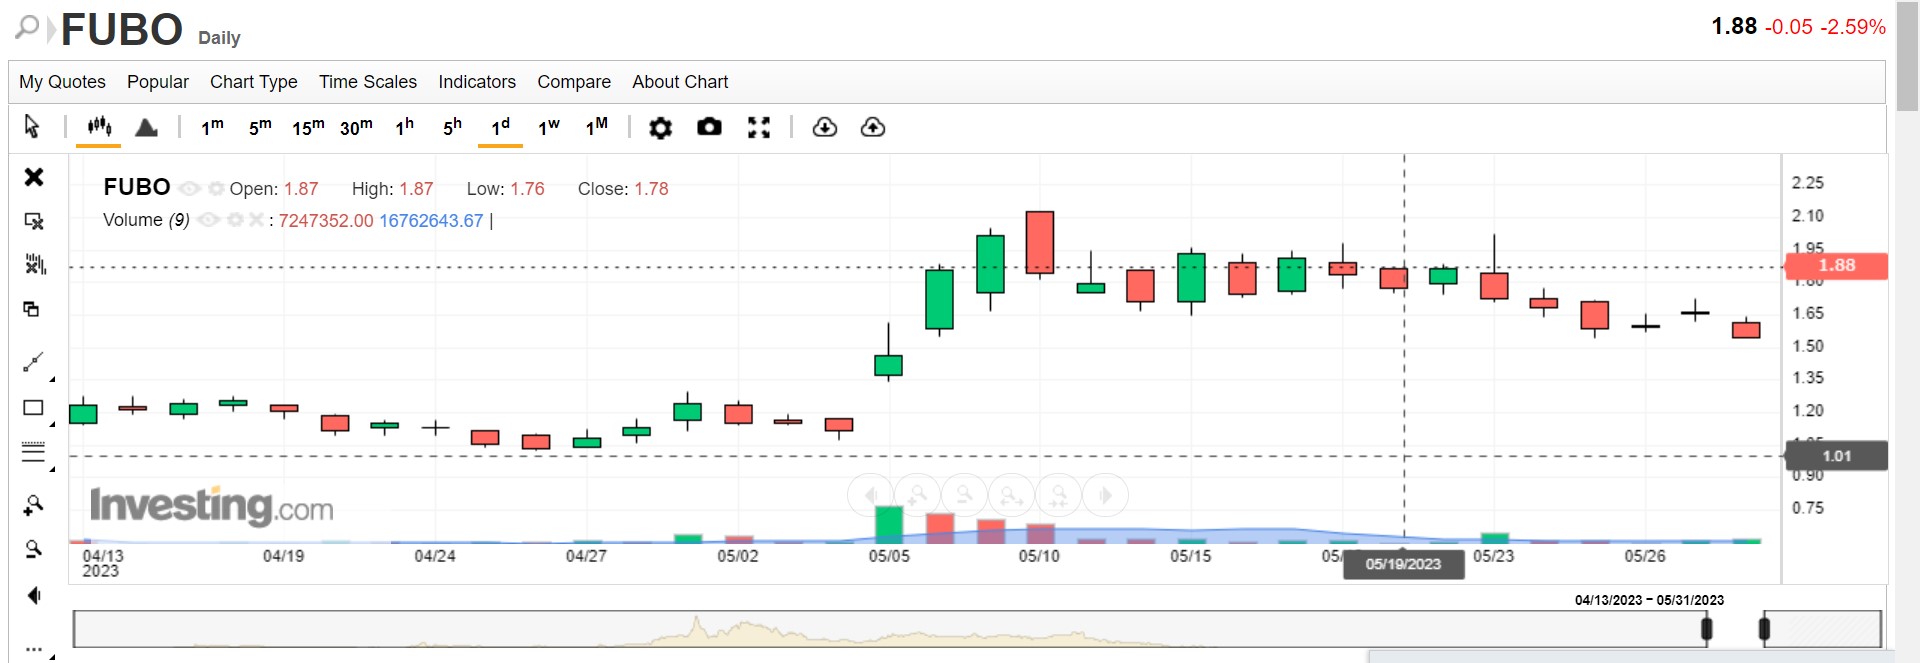
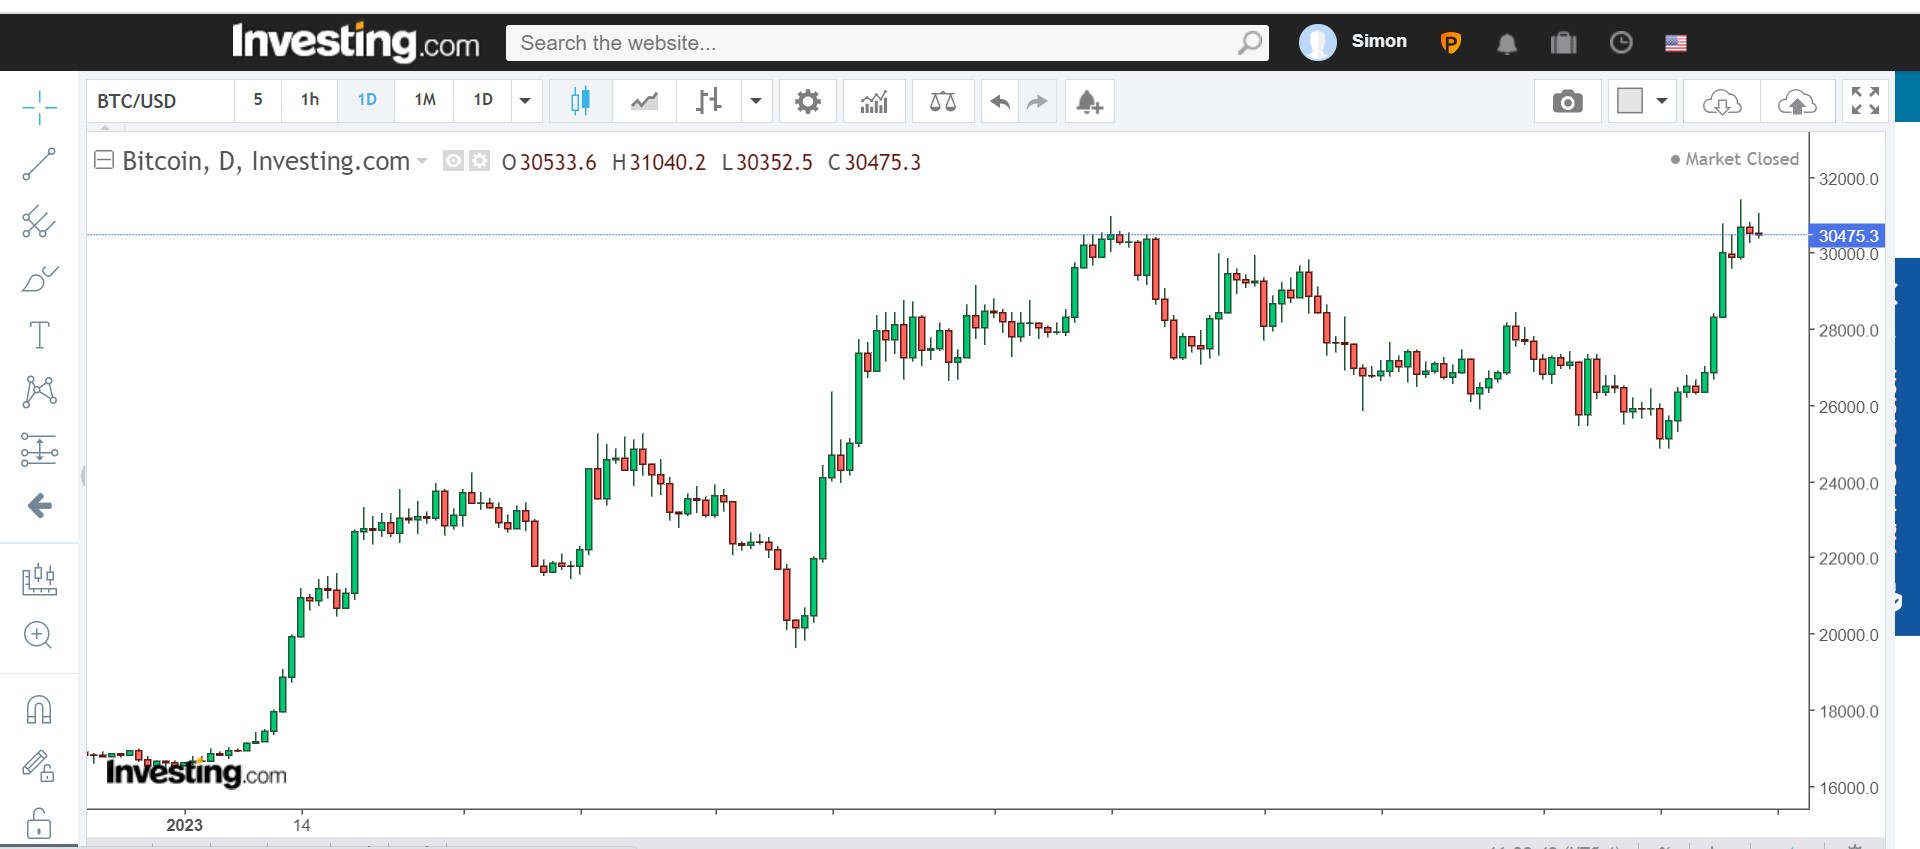
1.3 Candlestick Charts
Candlestick charts provide a visual representation of price movements using candle-shaped bars. Each candlestick represents the open, high, low, and close prices for a given period.
1.4 Renko Charts
Renko charts focus solely on price movements and disregard time intervals, making them useful for identifying trends and filtering out market noise.
1.5 Point and Figure Charts
Point and Figure charts use X’s and O’s to represent price movements, filtering out minor fluctuations and emphasizing significant price changes.
2. Key Technical Indicators for Chart Analysis
Technical indicators help traders interpret chart patterns and identify potential entry or exit points in the market. Here are some essential technical indicators:
2.1 Moving Averages
Moving averages smooth out price data by calculating the average closing price over a specified period, providing insights into trend direction.
2.2 Relative Strength Index (RSI)
The RSI measures the speed and change of price movements, indicating overbought or oversold conditions in a stock.
2.3 Bollinger Bands
Bollinger Bands consist of a moving average and two standard deviation lines, helping traders identify volatility and potential price reversals.
2.4 MACD (Moving Average Convergence Divergence)
The MACD is a trend-following momentum indicator that highlights potential buy or sell signals by comparing short-term and long-term moving averages.
2.5 Fibonacci Retracement
Fibonacci retracement levels help identify potential support and resistance levels based on the Fibonacci sequence, aiding in predicting price reversals.
3. Analyzing Price Patterns and Trends
Understanding price patterns and trends is crucial for successful chart reading. Here are some key concepts to consider:
3.1 Support and Resistance Levels
Support levels act as a floor for stock prices, while resistance levels act as a ceiling. Identifying these levels helps traders make informed decisions about entry and exit points.
3.2 Trendlines
Trendlines connect consecutive highs or lows, providing insights into the overall direction of the market.
3.3 Chart Patterns
Chart patterns, such as head and shoulders, double tops and bottoms, triangles, flags, and pennants, offer valuable information about potential trend reversals or continuations.
4. Developing Effective Trading Strategies
To maximize profitability, traders should employ effective trading strategies based on their risk tolerance and market conditions. Here are some popular strategies:
4.1 Breakout Trading Strategy
Breakout trading involves entering a trade when the price breaks above resistance or below support levels, anticipating a significant price movement.
4.2 Trend Following Strategy
Trend following strategies involve identifying established trends and entering trades in the direction of the prevailing trend.
4.3 Swing Trading Strategy
Swing trading aims to capture short-to-medium-term price movements within an established trend, typically holding positions for several days to weeks.
4.4 Mean Reversion Strategy
Mean reversion strategies involve identifying overbought or oversold conditions and taking positions based on the expectation that prices will revert to their mean.
5. Risk Management and Emotional Discipline
Successful traders prioritize risk management and emotional discipline. Here are some key practices:
5.1 Setting Stop-Loss Orders
Stop-loss orders help limit potential losses by automatically triggering a sell order if the price reaches a predetermined level.
5.2 Position Sizing
Position sizing involves determining the appropriate amount of capital to allocate to each trade based on risk tolerance and account size.
5.3 Controlling Emotions
Emotional discipline is crucial for avoiding impulsive decisions driven by fear or greed, which can lead to poor trading outcomes.
6. Backtesting and Paper Trading
Backtesting involves testing trading strategies using historical data to assess their effectiveness. Paper trading allows traders to practice without risking real money.
7. Chart Reading Tools and Software
Various online charting platforms and technical analysis software provide advanced tools for chart analysis, including real-time data, indicators, and drawing tools.
Remember to try out PyjamasTraders currency converter
Simon Frandsen / Pyjamastraders