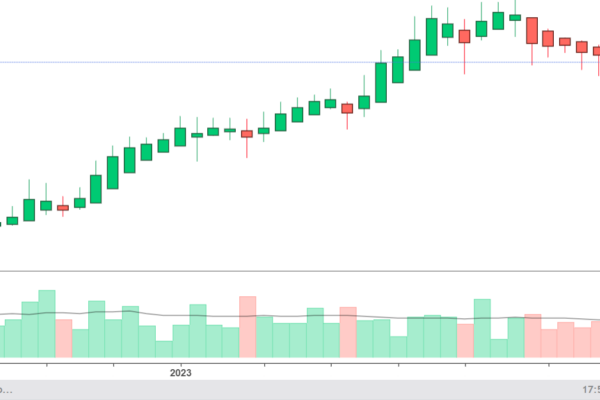
On-Balance Volume (OBV) in Trading
Understanding On-Balance Volume (OBV) in Trading One term you’re likely to come across is On-balance volume (OBV). But what exactly is this concept? In the most layman terms possible, on-balance volume is…
Day trading & Swing trading

Understanding On-Balance Volume (OBV) in Trading One term you’re likely to come across is On-balance volume (OBV). But what exactly is this concept? In the most layman terms possible, on-balance volume is…
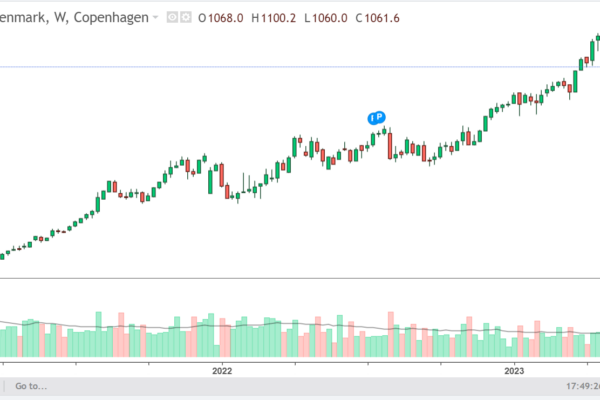
The Best Technical Indicators in Day Trading Download this article as PDF for free! Day trading is a popular form of short-term trading that involves buying and selling financial instruments within the…

Understanding MACD in Technical Analysis Technical analysis is a widely used approach in financial markets to predict future price movements based on historical data. One of the most popular indicators used in…
Exploring the Exponential Moving Average (EMA) in Trading Many technical indicators are employed to analyze price trends and make informed decisions. One such indicator is the Exponential Moving Average (EMA). The EMA…
Understanding Heikin Ashi Candles In the world of technical analysis, traders and investors rely on various tools and indicators to make informed decisions. One such tool is Heikin Ashi candles, which provide…
Understanding Simple Moving Average (SMA) Technical analysis is a popular approach used by traders to make informed decisions in the financial markets. One widely used tool in technical analysis is the Simple…

Understanding Bollinger Bands in Trading Bollinger Bands are very popular technical analysis tool used by traders to identify potential price reversals, gauge market volatility, and determine entry and exit points. Developed by…

Relative Strength Index (RSI) Technical analysis is a popular method used by traders and banks to predict future price movements based on past market data. One of the most widely used technical…