Technical analysis is a method used by traders all over the worls to analyze financial markets and make trading decisions. It involves studying past market data, primarily price and volume, to identify patterns and trends that can help predict future price movements. In this blog post on Pyjamastraders, we will explore the basics of technical analysis, its key concepts, and how it can be used in you trading.
The Basics of Technical Analysis
Technical analysis is based on the idea that market trends, whether up or down, tend to continue over time. This means that if a stock has been rising in price, it is more likely to continue rising than to suddenly reverse course and start falling. Similarly, if a stock has been falling in price, it is more likely to continue falling than to suddenly reverse course and start rising.
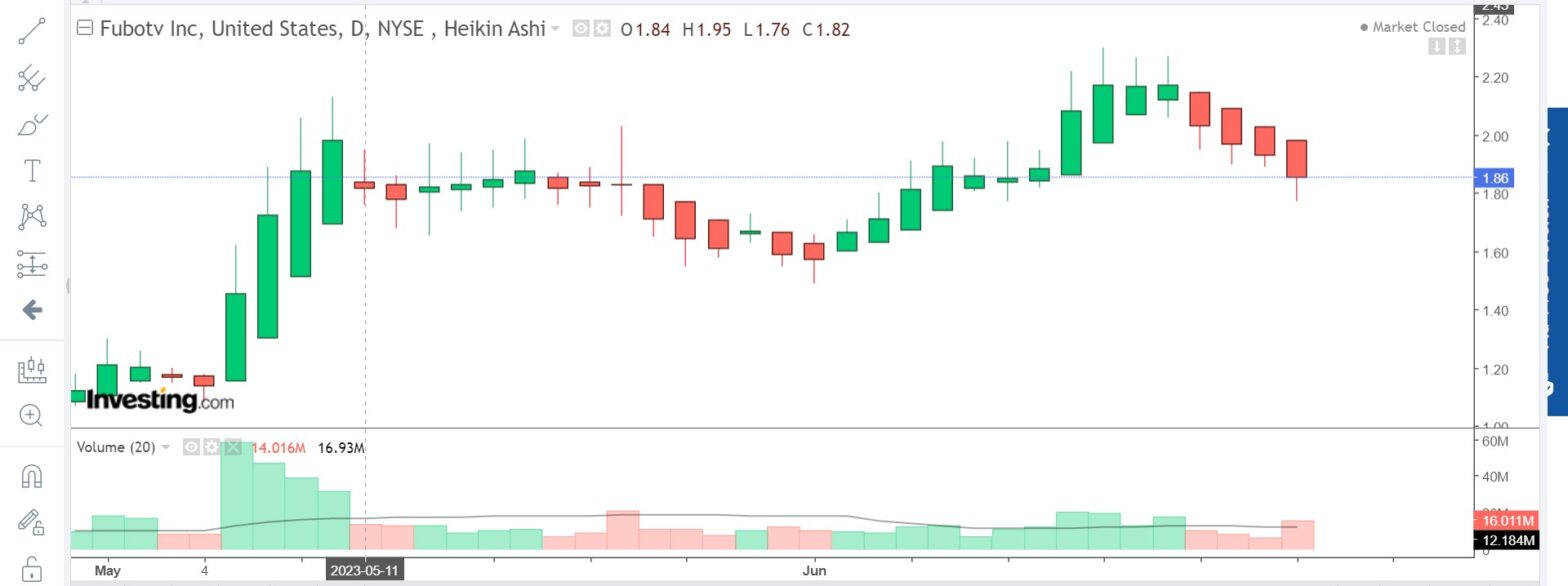
To identify these trends, technical analysts use charts that plot the price and volume of a security over time. These charts can take many forms, including line charts, bar charts, and candlestick charts. Line charts simply plot the closing price of a security over time, while bar charts show the opening, high, low, and closing prices for each period. Candlestick charts are similar to bar charts but use colored bars to indicate whether the closing price was higher or lower than the opening price.
Once a chart has been created, technical analysts look for patterns that can help predict future price movements. Some common patterns include:
– Trendlines: These are lines drawn on a chart that connect two or more points on the chart. If the trendline is sloping upward, it indicates an uptrend; if it is sloping downward, it indicates a downtrend.
– Support and resistance levels: These are levels on a chart where the price has historically had difficulty breaking through. If the price approaches a support level from below, it is more likely to bounce off that level and start rising; if it approaches a resistance level from above, it is more likely to bounce off that level and start falling.
– Chart patterns: These are specific shapes that appear on a chart, such as triangles, head and shoulders, and double tops/bottoms. These patterns can indicate a potential trend reversal or continuation.
Technical analysts also use a variety of indicators to help identify trends and patterns. These indicators are typically based on mathematical calculations of price and/or volume data. Some common indicators include:
– Moving averages: These are lines drawn on a chart that show the average price of a security over a certain period of time. They can help identify trends and potential trend reversals.
– Relative strength index (RSI): This is an indicator that measures the strength of a security’s price action relative to its own past performance. It can help identify overbought or oversold conditions.
– Bollinger Bands: These are bands drawn on a chart that show the upper and lower limits of a security’s “normal” price range based on its past volatility. They can help identify potential trend reversals.
Key Concepts in Technical Analysis
There are several key concepts that underpin technical analysis:
– Efficient market hypothesis: This is the idea that financial markets are efficient and all available information is already reflected in the price of a security. Technical analysts reject this hypothesis, arguing that market trends can be identified by studying past price and volume data.
– Price action: This refers to the movement of a security’s price over time. Technical analysts believe that price action contains valuable information about future price movements.
– Support and resistance levels: As mentioned earlier, these are levels on a chart where the price has historically had difficulty breaking through. Technical analysts believe that these levels can help predict future price movements.
– Trendlines: These are lines drawn on a chart that connect two or more points on the chart. Technical analysts believe that trends tend to continue over time and that trendlines can help identify these trends.
– Indicators: These are mathematical calculations based on price and/or volume data that can help identify trends and potential trend reversals.
Using Technical Analysis in Trading
Technical analysis can be used in a variety of trading strategies, including day trading, swing trading, and position trading. Day traders typically use technical analysis to make short-term trades based on intraday price movements. Swing traders use technical analysis to identify trends that last several days to several weeks. Position traders use technical analysis to identify long-term trends that can last several months to several years.
To use technical analysis effectively, traders must have a solid understanding of the key concepts and be able to interpret charts and indicators accurately. They must also be able to manage risk effectively by setting stop-loss orders and using proper position sizing.
It is important to note that technical analysis is not foolproof and should not be used in isolation. Other factors, such as fundamental analysis, market sentiment, and geopolitical events, can also impact market movements. Traders should use a variety of tools and strategies to make informed trading decisions.
Remember to try out PyjamasTraders currency converter
Technical analysis is a popular method used by traders to analyze financial markets and make trading decisions. It involves studying past market data, primarily price and volume, to identify patterns and trends that can help predict future price movements. Technical analysts use charts, indicators, and key concepts such as support and resistance levels and trendlines to identify these patterns. While technical analysis can be a valuable tool for traders, it should not be used in isolation and should be combined with other tools and strategies for best results.
Simon Frandsen / Pyjamastraders